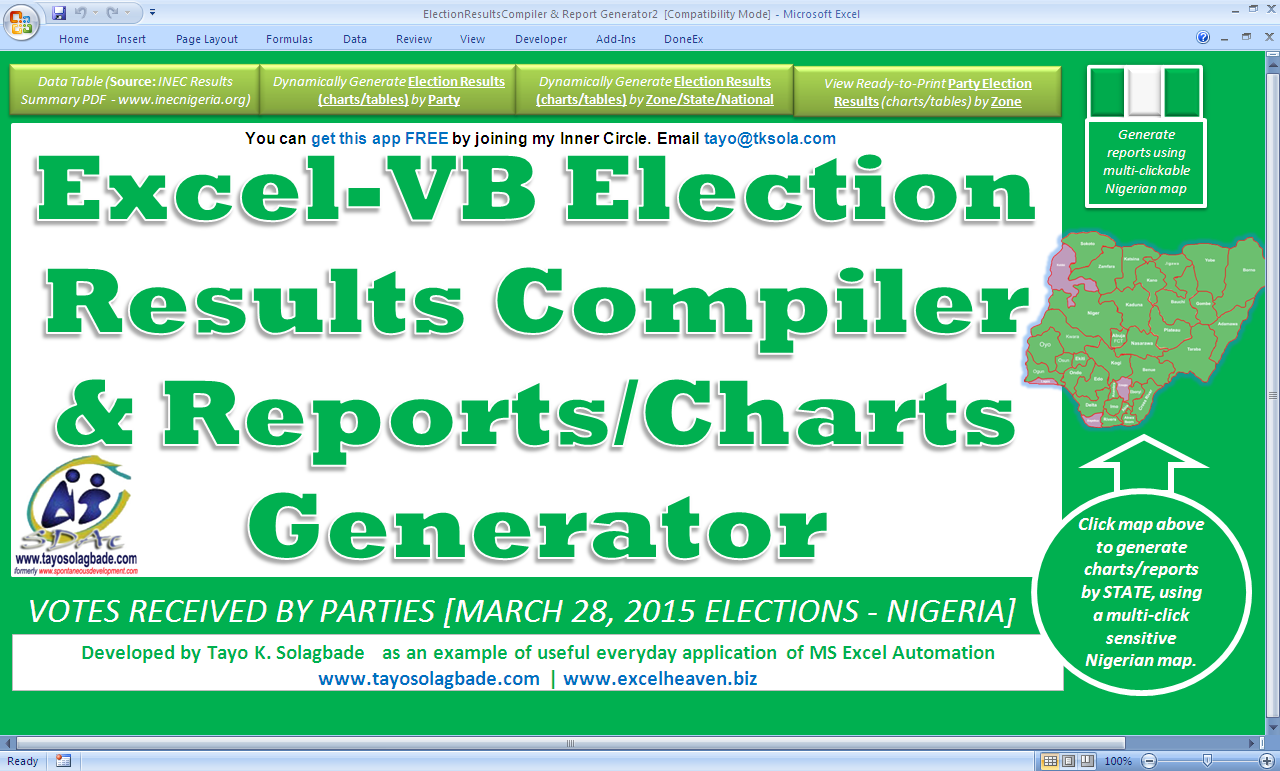
[2 Part Video] Tayo Solagbade's Excel-VB Elections Results Compiler & Reports/Charts Generator - Based on INEC Nigeria's Summary of Results for the March 28th, 2015 Presidential Elections
In this 2 part video demonstration, summary reports and charts are auto generated by my new Excel-VB Elections Results Compiler & Reports/Charts Generator, which I built mainly to demonstrate how Excel can be used to boost productivity in everyday activities.
[I began building the app around 25th April 2015. Today, 7th May 2015, I'm putting up the 2 part demonstration video, below, of the fully functional app, ready for use]
The idea here is to show the potentially limitless ways you can use Excel to boost your routine data recording, analysis and report generation in ANY field you work.
Most people think Excel is only useful for financial reporting.
NOT TRUE!
In reality ANY activity in which data handling/manipulation for trending and decision making happens CAN be improved with use of MS Excel ...especially when smart functions and intelligent VBA coding is employed by competent persons.
Imagine your organization being able to click each state (or LGA, Zone, even country) on ANY map to generate instant tables and charts of products sales totals, marketing expenses and other data across your sites nationwide, for a day, week, month, year etc?
That's what I'm trying to show with this app!
Click here to watch the 2 part video demonstration of this app in use
If you'd like to own a copy of the fully functional version, click here to let me know.